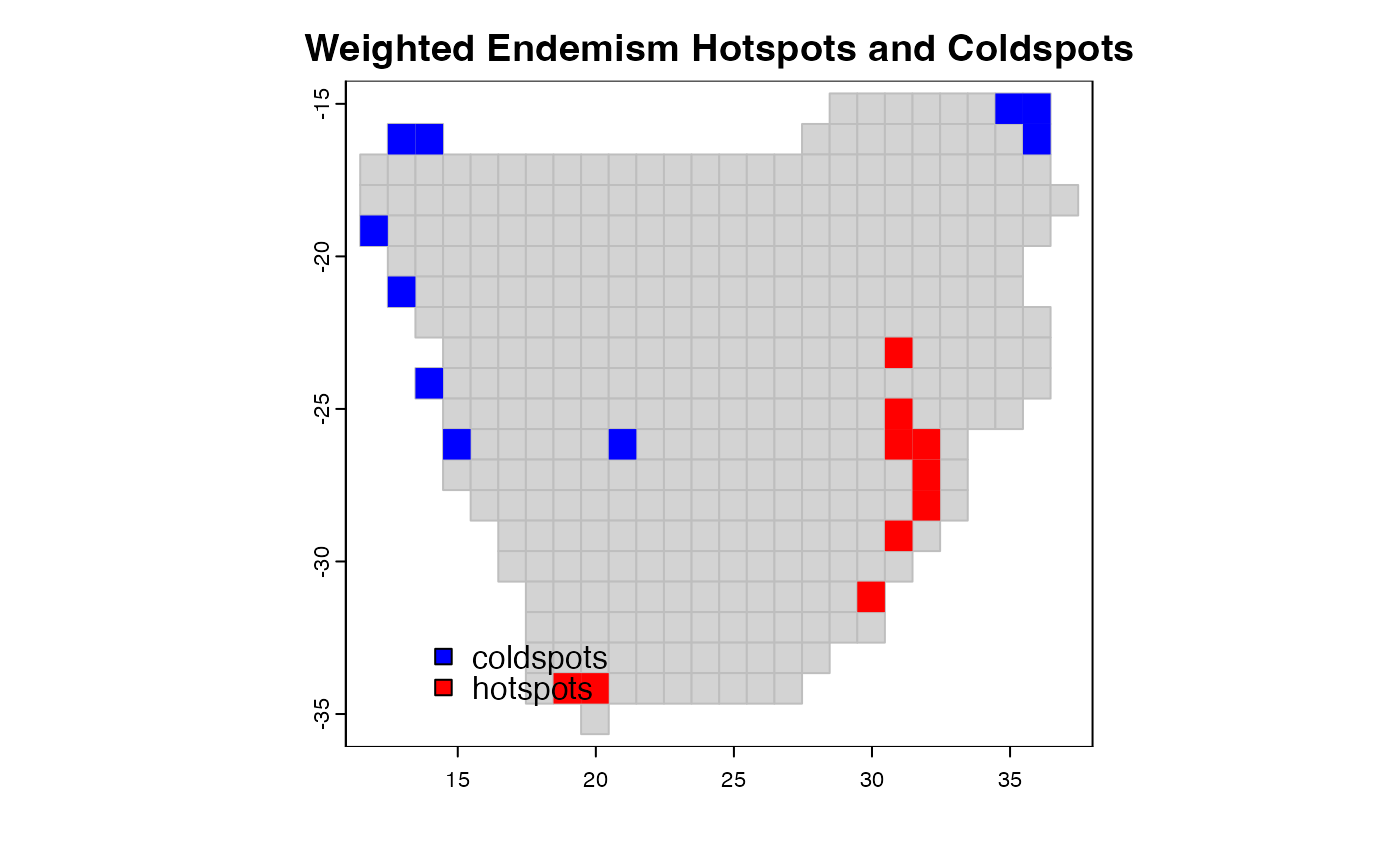
coldspots and hotspots map areas or grid cells with lowest
or highest values, respectively, of a biodiversity metric e.g.
species richness, species endemism or degree of threat.
coldspots(x, y = NULL, prob = 2.5, ...)

hotspots(x, y = NULL, prob = 2.5, ...)

rast_hotspot(ras, ref = NULL, prob = 10)
Arguments
- x
a vector on which to compute hotspots or coldspots
- y
a vector on which to compare x against
- prob
The threshold quantile for representing the lowest (
coldspots) or highest (hotspots) proportion of biodiversity in an area. By default, the threshold is set toprob = 2.5percent.- ...
Further arguments passed to or from other methods.
- ras
a SpatRaster on which to compute hotspots.
- ref
a raster layer for reference.
Value
A vector of integers of 1s and 0s with 1 corresponding to the coldspots or hotspots
References
Myers, M., Mittermeier, R.A., Mittermeier, C.G., da Fonseca, G.A.B. & Kent, J. (2000) Biodiversity hotspots for conservation priorities. Nature 403: 853–858.
Ceballos, G. & Ehrlich, P.R. (2006) Global mammal distributions, biodiversity hotspots, and conservation. Proceedings of the National Academy of Sciences USA 103: 19374–19379.
Orme, C.D., Davies, R.G., Burgess, M., Eigenbrod, F., Pickup, N. et al. (2005) Global hotspots of species richness are not congruent with endemism or threat. Nature 436: 1016–1019.
Daru, B.H., Van der Bank, M. & Davies, T.J. (2015) Spatial incongruence among hotspots and complementary areas of tree diversity in southern Africa. Diversity and Distributions 21: 769-780.
Examples
library(terra)
data(africa)
p <- vect(system.file("ex/sa.json", package = "phyloregion"))

Endm <- weighted_endemism(africa$comm)
C <- coldspots(Endm, na.rm=TRUE) # coldspots
H <- hotspots(Endm, na.rm=TRUE) # hotspots

## Merge endemism values to shapefile of grid cells.
DF <- data.frame(grids=names(C), cold=C, hot=H)
m <- merge(p, DF, by = "grids", all = TRUE)

plot(p, border = "grey", col = "lightgrey",
     main = "Weighted Endemism Hotspots and Coldspots")
plot(m[(m$cold == 1), ], col = "blue", add = TRUE, border = NA)
plot(m[(m$hot == 1), ], col = "red", add = TRUE, border = NA)
legend("bottomleft", fill = c("blue", "red", "yellow", "green"),
       legend = c("coldspots", "hotspots"), bty = "n", inset = .092)